Decoding Momentum Shifts in Tennis Sets Through Serve Percentage Trajectories
Hugo Hartmann · Aug 11, 2026
Decoding Momentum Shifts in Tennis Sets Through Serve Percentage Trajectories
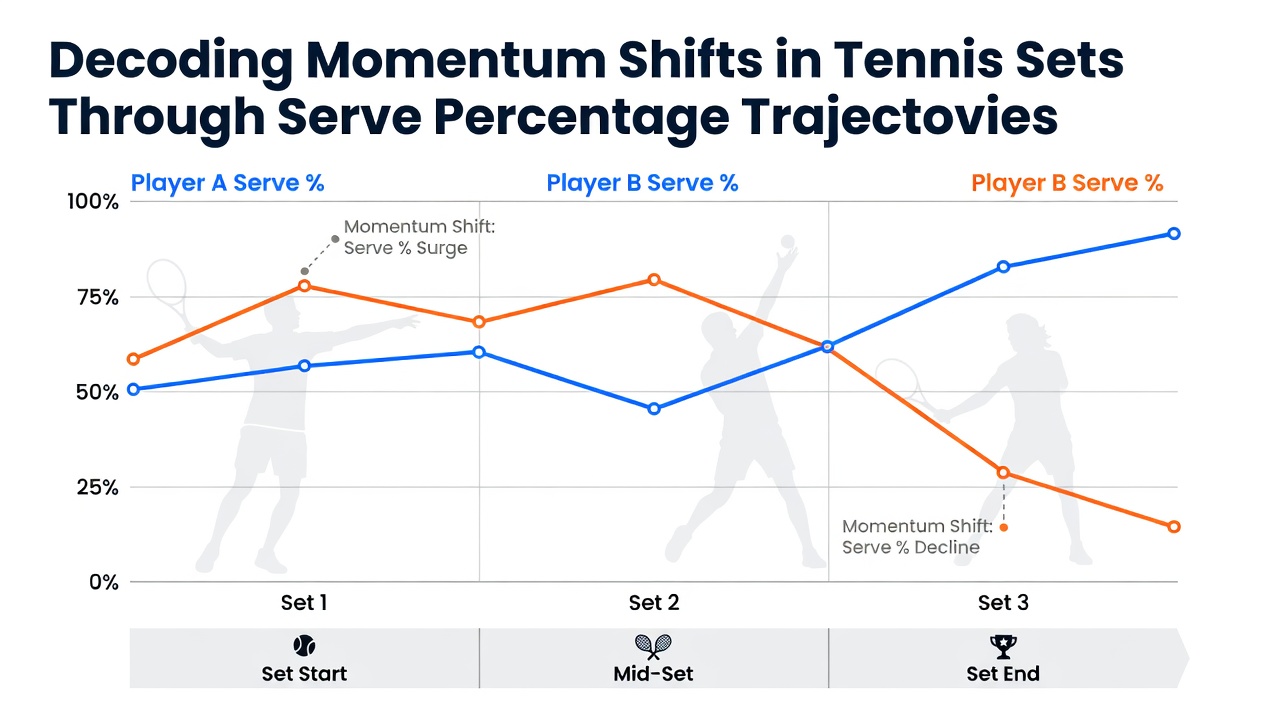
Analysts track serve percentage trajectories to identify momentum changes within individual sets because first-serve win rates and overall service points won often shift before scoreboards reflect those changes. Data collected from professional matches shows that players who maintain first-serve percentages above 65 percent typically hold serve more consistently, yet those figures can drop sharply when fatigue or tactical adjustments occur.
Understanding Serve Percentage Metrics
Serve percentage encompasses several measurable components including first-serve in rate, first-serve points won, and second-serve points won. Researchers compile these statistics point by point during matches and plot them against elapsed time or game count to reveal upward or downward trajectories. Studies from match analysis teams indicate that a sustained decline of 10 percentage points or more in first-serve win rate frequently precedes a break of serve within the next two or three games.
Second-serve performance adds another layer because players who convert above 55 percent of second-serve points tend to neutralize aggressive returns. Observers note that trajectories become particularly informative when one player’s first-serve percentage falls while the opponent’s remains stable, creating measurable pressure that alters rally lengths and error rates.
Tracking Trajectories in Real Time
Coaches and performance analysts use software that logs each serve outcome alongside court surface and opponent handedness. These systems generate line graphs that update after every point, allowing viewers to spot inflection points where momentum begins to tilt. Data from multiple Grand Slam events demonstrates that sets lasting longer than 45 minutes produce more pronounced trajectory swings because physical conditioning starts to influence service accuracy.
August 2026 tournaments provided fresh datasets because several matches extended into tiebreaks after serve percentages fluctuated repeatedly. Analysts compared these patterns against shorter sets and found that early trajectory dips often predicted extended contests when both competitors adjusted tactics mid-set.
Case Examples from Recent Matches
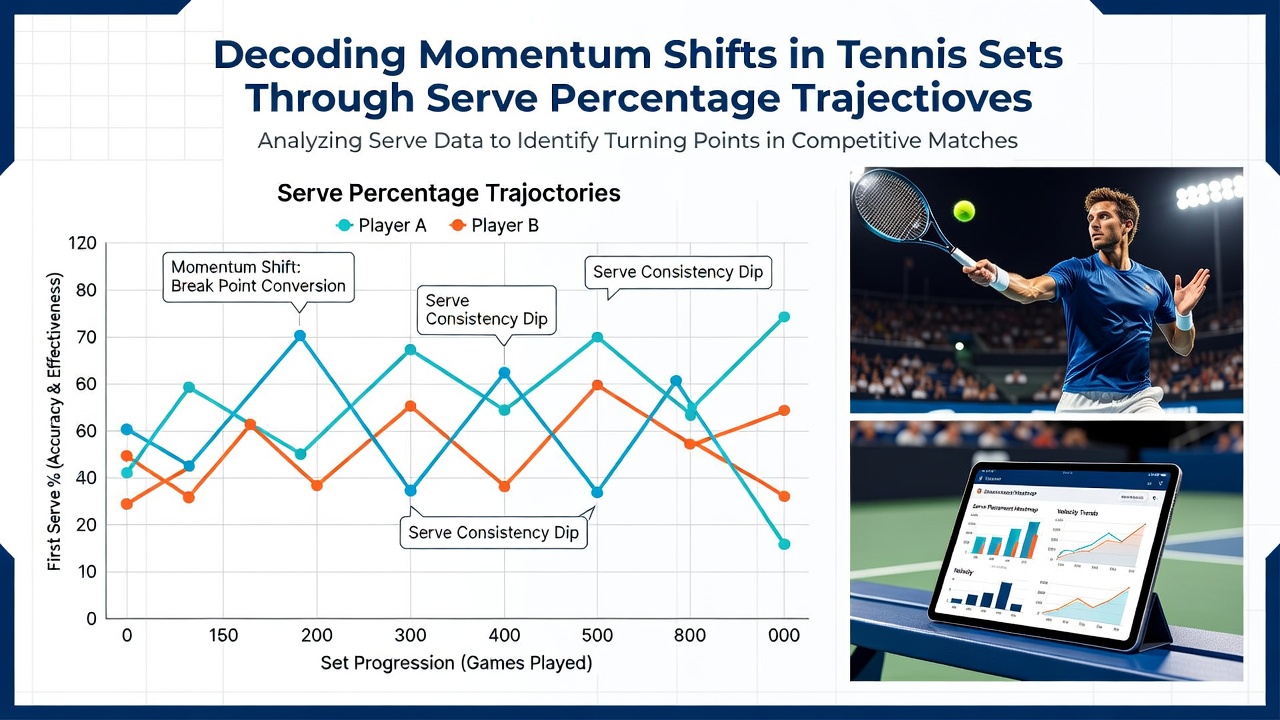
One notable encounter occurred when a top-seeded player opened a set with 78 percent first-serve points won yet saw that figure drop to 58 percent after the fourth game. The opponent capitalized by increasing return depth, which forced more second serves and reduced the server’s win rate on those points. Match logs reveal the trajectory reversal happened before the eventual break, giving analysts an early signal of the shift.
Another instance involved two baseline-oriented competitors whose serve percentages remained nearly identical through the first five games. After one player introduced more slice serves wide to the ad court, the opponent’s return success rate declined, and the serve percentage trajectory turned upward for the server while the returner’s effective return percentage fell correspondingly. Such adjustments illustrate how small tactical changes can redirect statistical paths within a single set.
Integration with Broader Performance Data
Serve percentage trajectories gain additional context when paired with rally length statistics and unforced error counts. Teams that combine these datasets report stronger correlations between service success and overall point-winning probability. Academic research published through sports science departments has examined how altitude and court speed modify these relationships, showing that higher bounce surfaces tend to stabilize serve win rates while faster courts amplify small percentage differences into larger scoreline impacts.
International federations including the International Tennis Federation maintain centralized databases that allow comparison across surfaces and player rankings. These repositories enable analysts to benchmark individual trajectories against historical norms for similar match conditions and player profiles.
Applications for Training and Preparation
Coaching staffs review serve percentage graphs during post-match debriefs to identify which service patterns held steady and which eroded under pressure. Players then adjust practice drills to reinforce the elements that produced favorable trajectories. Data collected over multiple tournaments indicates that targeted repetition of second-serve patterns can improve win rates by several percentage points within a single season.
Scouting reports now routinely include projected trajectory ranges based on previous head-to-head results and recent form. These projections help teams anticipate when an opponent might experience a service downturn and prepare return strategies accordingly.
Conclusion
Serve percentage trajectories supply a quantifiable method for recognizing momentum changes before they appear on the scoreboard. Comprehensive datasets from professional events demonstrate consistent patterns linking service success rates to break opportunities and set outcomes. Continued refinement of tracking technology and statistical modeling allows analysts to extract increasingly precise insights from each match played.